目录
0 前言
在进行模块的负载优化时,使用到了 Google 开发的 gperftools 工具来进行代码性能分析。正如 gperftools wiki 中所描述的:
gperftools is a collection of a high-performance multi-threaded
malloc()implementation, plus some pretty nifty performance analysis tools.gperftools 是一系列高性能多线程
malloc()实现的集合,同时添加了一些精巧的性能分析工具。
gperftools 性能分析工具主要包含五部分:
- TC Malloc
- Heap Checker
- Heap Profiler
- CPU Profiler
- pprof
本文中将使用 CPU Profiler 和 pprof 进行代码性能分析。其中,CPU Profiler 用于生成后缀为 .prof 的 profile 性能描述文件,pprof 是用于解析 profile 文件的 perl 脚本工具。
1 安装
1.1 基础软件
在命令行中通过 apt 安装 autoconf、automake、libtool:
1 | sudo apt install autoconf automake libtool |
1.2 libunwind
gperftools 在 64 位操作系统下需要 libunwind 库的支持,libunwind 提供了可用于分析程序调用栈的 API,可直接执行下述命令行进行安装:
1 | cd ~ |
1.3 graphviz
gperftools 使用 graphviz 将代码性能分析结果进行图形化显示。graphviz 是一个由 AT&T 实验室开发的开源工具包,用于绘制 DOT 语言脚本描述的图形,Ubuntu 中可通过 apt 直接安装:
1 | sudo apt install graphviz |
1.4 gperftools
gperftools 可直接执行下述命令行进行安装:
1 | cd ~ |
2 使用
下文中将使用的 C++ 工程 Demo 可点击这里下载。
2.1 代码插桩
在使用 gperftools 进行代码性能分析前,需要进行代码插桩:
插入头文件:
1
在待分析的代码块前插入 Profiler 开始语句:
1
ProfilerStart("file_name.prof");
file_name.prof表示.prof文件的文件名。在待分析的代码块后插入 Profiler 结束语句:
1
ProfilerStop();
完整的插桩示例:
1 |
|
2.2 编译链接
编译时我们需要将 profiler 库和 libunwind 库链接到可执行程序,对应的 CMakeLists 文件中的语句为:
1 | target_link_libraries(${PROJECT_NAME} profiler unwind) |
2.3 运行可执行程序
找到编译得到的可执行程序,并在终端中运行:
1 | ./cpp_demo |
正常情况下,会生成一个我们上文中所提到的 .prof 文件,如果报动态链接库找不到的问题,手动执行下动态链接库的管理命令 ldconfig 即可:
1 | sudo ldconfig |
ldconfig 可执行程序存放在 /sbin 目录下,通常在系统启动时运行,而当用户安装了一个新的动态链接库时,需要手动运行这个命令。运行 ldconfig 会刷新动态装入程序 ld.so 所需的链接和缓存文件 /etc/ld.so.cache(此文件保存了已排好序的动态链接库名字列表),实现动态链接库为系统所共享。
2.4 生成图形化分析报告
最后,通过上文提到的 pprof 解析 .prof 文件。pprof 有多种使用方法,下面的命令行将 .prof 文件解析为 .pdf 文件:
1 | pprof --pdf cpp_demo cpp_demo_perf.prof > cpp_demo_perf.pdf |
解析得到的 .pdf 文件中保存了图形化的代码性能分析结果,从中我们可以查找代码的性能瓶颈:
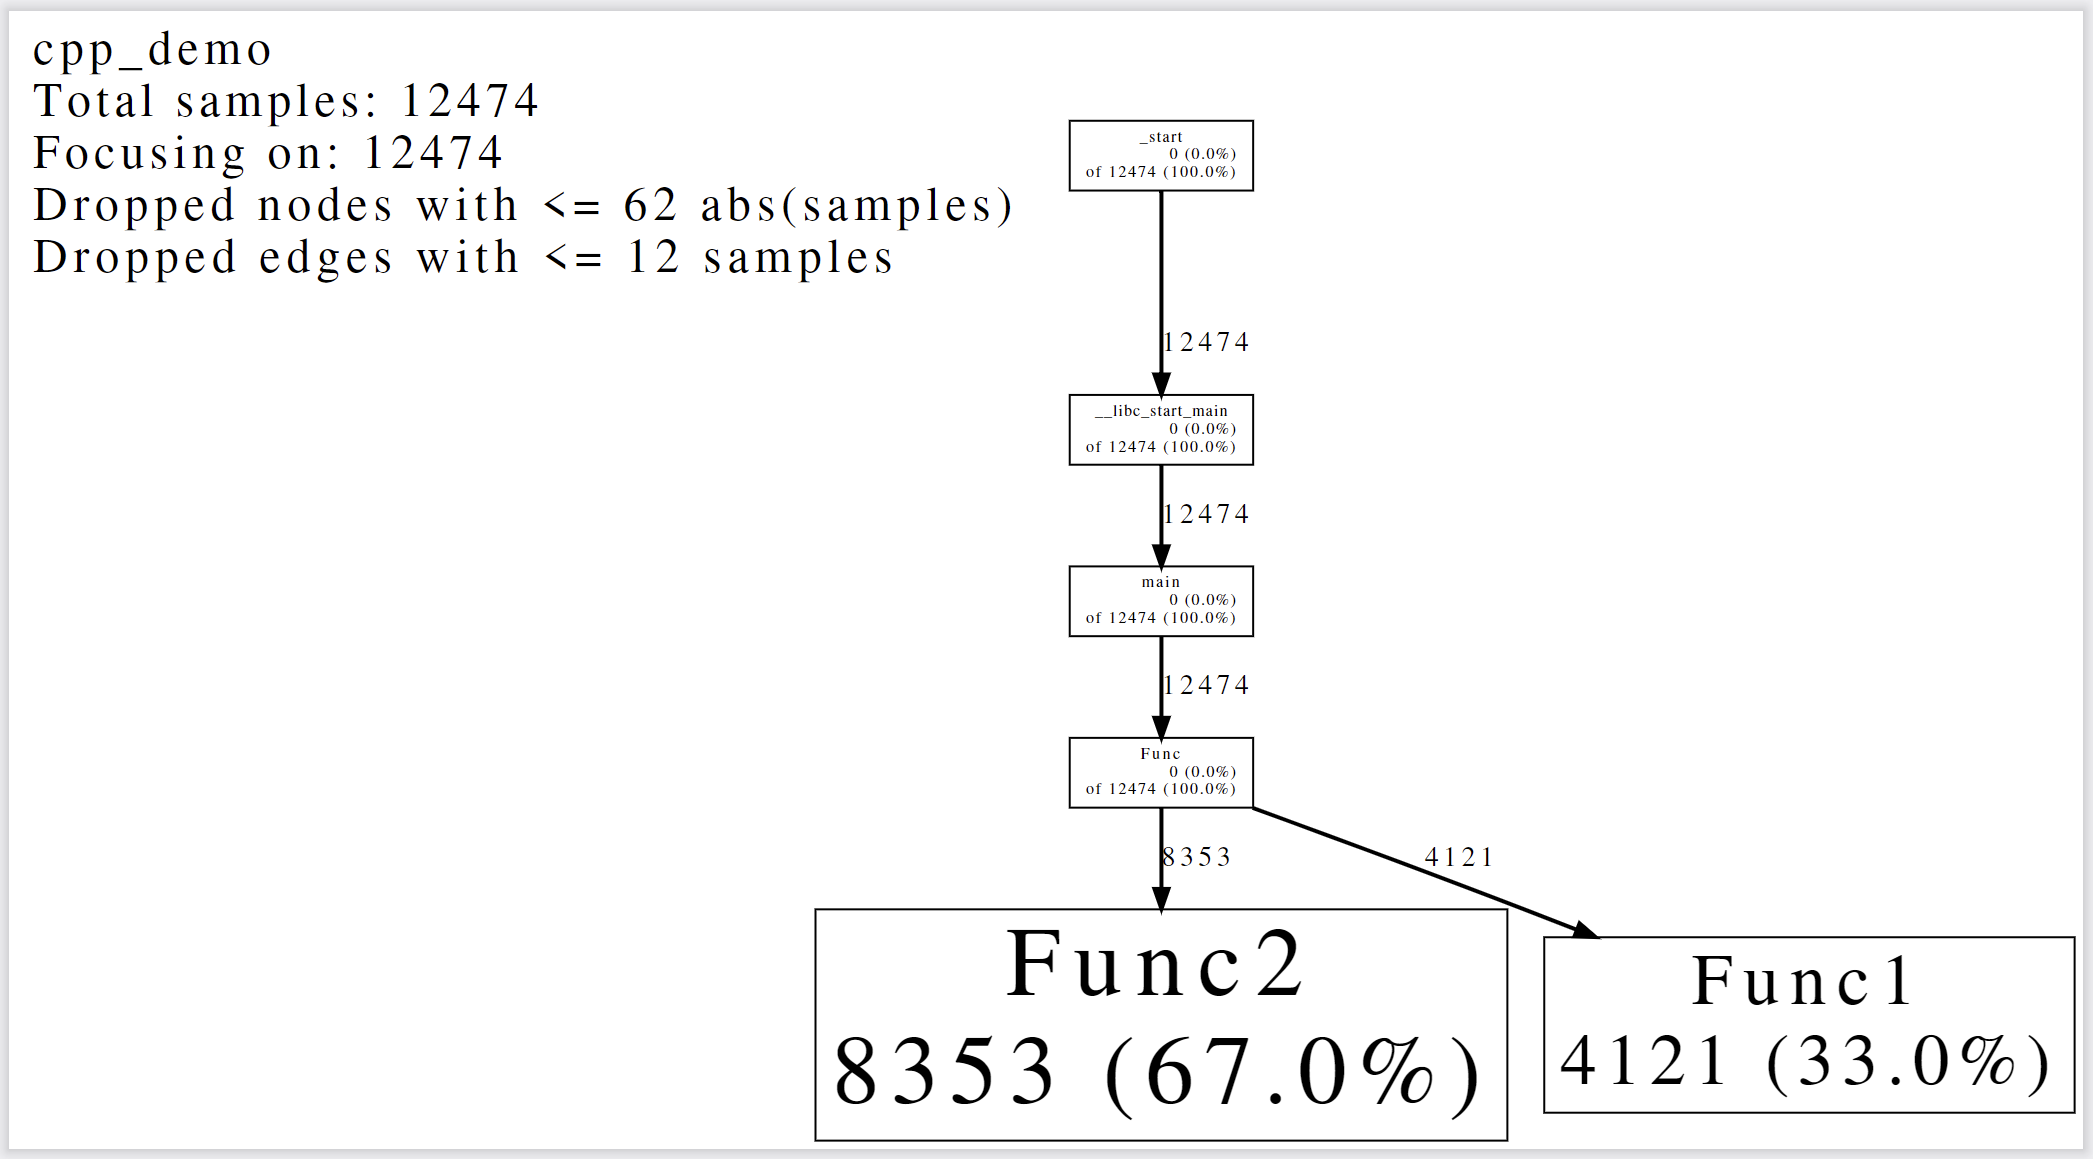
每一个方框表示一个进程,有向边表示进程间的调用关系。方框越大,表示该进程耗时越高,这里我们可以发现,Func2 函数占了程序总耗时的 67%,是程序的性能瓶颈。需要注意的是,gperftools 的 CPU Profiler 是通过采样的方式工作的,如果程序运行时间太短,会导致样本不足从而造成分析结果不准确。
关于图形化分析结果更详细的解释,可以参考这里。
参考
- gperftools wiki
- gperftools CPU profiler
- libunwind
- graphviz
- ldconfig 命令